The business environment is a dynamic ecosystem that shapes how companies operate, compete, and thrive. A business environment diagram is a powerful visual tool that illustrates the internal and external factors influencing a business. Whether you’re a startup founder, a corporate strategist, or a student of business management, understanding this diagram is key to making informed decisions. In this article, we’ll explore what a business environment diagram is, its components, and how to use it effectively, all while incorporating real-world examples and practical tips.
What Is a Business Environment Diagram?
A business environment diagram is a schematic representation of the various forces thaLearn how a business environment diagram helps businesses analyze internal and external factors for strategic planning and growth.t impact a company’s operations and success. It categorizes these forces into internal and external factors, helping businesses visualize their ecosystem. By mapping out these elements, organizations can identify opportunities, mitigate risks, and align their strategies with market realities.
Why is it important?
It provides a clear framework for analyzing the complex interplay of factors like economic trends, competitors, and internal capabilities. For instance, a retail company might use this diagram to assess how rising inflation (external) and employee productivity (internal) affect its bottom line.
Key Components of a Business Environment Diagram
A typical business environment diagram divides factors into two main categories: internal environment and external environment. Let’s break them down:
Internal Environment
The internal environment includes factors within a company’s control. These are often depicted in the center of the diagram, as they form the core of the business.
-
Organizational Structure: How the company is organized, including hierarchies and departmental roles.
-
Resources: Financial, human, and technological assets available to the business.
-
Culture: The values, beliefs, and work environment that shape employee behavior.
-
Processes: Systems for production, marketing, and customer service.
Example: Apple’s internal environment includes its innovative culture and robust R&D processes, which drive its ability to launch cutting-edge products like the iPhone.
External Environment
The external environment encompasses factors outside a company’s control. These are often divided into microenvironment and macroenvironment.
Microenvironment
The microenvironment includes stakeholders and forces close to the business:
-
Customers: Target audience segments, such as B2B or B2C markets.
-
Suppliers: Vendors providing raw materials or services.
-
Competitors: Other businesses vying for the same market share.
-
Partners: Strategic alliances or distributors.
Example: For Tesla, the microenvironment includes its customer base (eco-conscious consumers), suppliers (battery manufacturers), and competitors (like Rivian or BYD).
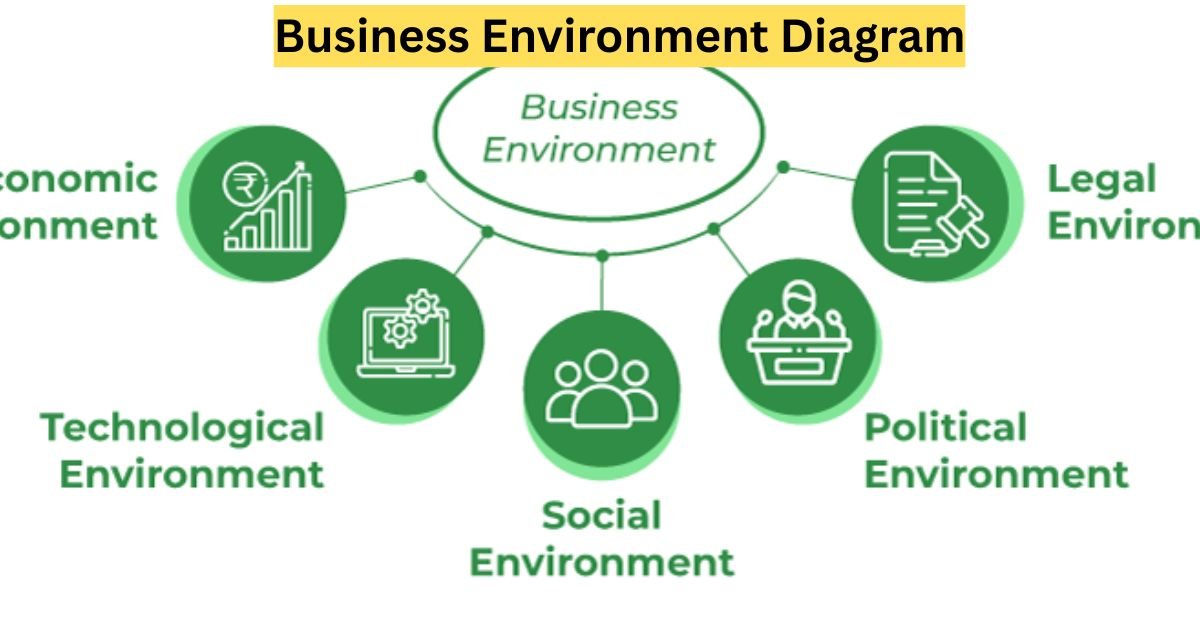
Macroenvironment
The macroenvironment covers broader societal forces, often analyzed using the PESTLE framework:
-
Political: Government policies, regulations, or trade agreements.
-
Economic: Inflation, unemployment, or GDP growth.
-
Social: Cultural trends, demographics, or consumer preferences.
-
Technological: Innovations or digital transformations.
-
Legal: Laws affecting operations, like labor or environmental regulations.
-
Environmental: Sustainability concerns or climate change impacts.
Example: A global coffee chain like Starbucks monitors the macroenvironment to adapt to rising minimum wages (economic) and growing demand for plant-based milk (social).
How to Create a Business Environment Diagram
Creating a business environment diagram is straightforward and can be done using tools like Canva, Lucidchart, or even PowerPoint. Here’s a step-by-step guide:
-
Identify the Business Focus: Define the company or project you’re analyzing.
-
Map Internal Factors: List resources, culture, and processes in the center of the diagram.
-
Outline the Microenvironment: Add stakeholders like customers and competitors in a surrounding layer.
-
Incorporate the Macroenvironment: Include PESTLE factors in an outer layer to show broader influences.
-
Visualize Connections: Use arrows or lines to show how factors interact (e.g., how a new regulation impacts suppliers).
-
Refine and Share: Ensure the diagram is clear, visually appealing, and shareable with stakeholders.
Pro Tip: Use color coding to differentiate internal, micro, and macro factors for better readability.
Why Use a Business Environment Diagram?
Business environment diagrams offer several benefits:
-
Clarity: Simplifies complex relationships between business factors.
-
Strategic Planning: Helps identify strengths, weaknesses, opportunities, and threats (SWOT).
-
Decision-Making: Guides resource allocation and risk management.
-
Communication: Serves as a visual aid for presenting insights to teams or investors.
Data Insight: According to a 2023 McKinsey report, companies that regularly analyze their business environment are 2.5 times more likely to achieve above-average growth.
How Does a Business Environment Diagram Support Strategic Planning?
A business environment diagram aligns with strategic planning by providing a holistic view of the operational landscape. For example, a SWOT analysis can be overlaid on the diagram to highlight:
-
Strengths: Internal advantages, like a strong brand.
-
Weaknesses: Internal limitations, such as outdated technology.
-
Opportunities: External possibilities, like emerging markets.
-
Threats: External risks, like new regulations.
Real-World Example: In 2020, Zoom used its business environment diagram to capitalize on the social shift toward remote work (macroenvironment) and rapidly scale its infrastructure (internal environment) to meet surging demand.
What Are the Challenges of Using a Business Environment Diagram?
While powerful, these diagrams have limitations:
-
Complexity: Overloading the diagram with too many factors can reduce clarity.
-
Dynamic Nature: The business environment changes rapidly, requiring frequent updates.
-
Subjectivity: Different stakeholders may prioritize factors differently.
Solution: Regularly revisit and refine the diagram, and involve cross-functional teams to ensure diverse perspectives.
Practical Tips for Leveraging a Business Environment Diagram
To maximize the value of your diagram, follow these tips:
-
Update Regularly: Review the diagram quarterly to reflect changes like new competitors or regulations.
-
Integrate with Tools: Combine the diagram with SWOT or Porter’s Five Forces for deeper insights.
-
Engage Stakeholders: Involve employees, suppliers, and customers to validate factors.
-
Use Data: Support your diagram with market research or industry reports for credibility.
-
Focus on Actionable Insights: Prioritize factors that directly impact your goals.
Example: A small e-commerce business might use its diagram to identify a growing trend in sustainable packaging (macroenvironment) and partner with eco-friendly suppliers (microenvironment) to differentiate itself.
How Can a Business Environment Diagram Improve SEO?
For digital businesses, a business environment diagram can inform SEO strategies:
-
Keyword Research: Identify customer pain points (microenvironment) to target long-tail keywords like “sustainable packaging solutions.”
-
Content Strategy: Address macro trends (e.g., “green business practices”) to create relevant blog posts.
-
Competitor Analysis: Monitor competitors’ SEO tactics to find gaps in your strategy.
LSI Keywords: business ecosystem, strategic analysis, market forces, PESTLE analysis, SWOT integration.
Table: Important Topics in a Business Environment Diagram
|
Topic |
Description |
Example |
|---|---|---|
|
Internal Environment |
Factors within the company’s control, like resources and culture. |
Apple’s innovation-driven culture and R&D processes. |
|
Microenvironment |
Stakeholders close to the business, such as customers and competitors. |
Tesla’s eco-conscious customers and competitors like Rivian. |
|
Macroenvironment |
Broad societal forces analyzed via PESTLE (Political, Economic, Social, etc.). |
Starbucks adapting to minimum wage hikes and plant-based milk trends. |
|
Strategic Planning |
Using the diagram to align goals with market opportunities and risks. |
Zoom scaling infrastructure during the remote work surge in 2020. |
|
SEO Integration |
Leveraging the diagram for keyword research and content strategies. |
Targeting “sustainable packaging solutions” for an e-commerce business. |
Common Questions About Business Environment Diagrams
What’s the Difference Between Micro and Macro Environments?
The microenvironment includes immediate stakeholders like customers and suppliers, while the macroenvironment covers broader forces like economic trends or regulations.
How Often Should You Update a Business Environment Diagram?
Update it at least quarterly or when significant market changes occur, such as new laws or competitor moves.
Can Small Businesses Use This Diagram?
Absolutely! Small businesses can use it to identify niche opportunities, like targeting local customers or leveraging low-cost digital tools.
See Also: top10ideas.org
Conclusion
A business environment diagram is more than just a visual aid—it’s a strategic compass for navigating the complexities of today’s markets. By mapping internal strengths, microenvironment stakeholders, and macroenvironment trends, businesses can make data-driven decisions that drive growth. Whether you’re a small business owner or a corporate leader, this tool empowers you to stay agile and competitive.